Generate bootstrap plots
Source:R/generate_bootstrap_plots_for_transcriptome.r
generate_bootstrap_plots_for_transcriptome.RdTakes a gene list and a single cell type transcriptome dataset and generates plots which show how the expression of the genes in the list compares to those in randomly generated gene lists.
generate_bootstrap_plots_for_transcriptome(
  sct_data,
  tt,
  bg = NULL,
  thresh = 250,
  annotLevel = 1,
  reps = 100,
  full_results = NA,
  listFileName = "",
  showGNameThresh = 25,
  ttSpecies = NULL,
  sctSpecies = NULL,
  output_species = NULL,
  sortBy = "t",
  sig_only = TRUE,
  sig_col = "q",
  sig_thresh = 0.05,
  celltype_col = "CellType",
  plot_types = c("bootstrap", "bootstrap_distributions", "log_bootstrap_distributions"),
  save_dir = file.path(tempdir(), "BootstrapPlots"),
  method = "homologene",
  verbose = TRUE
)
Arguments
- sct_data
List generated using generate_celltype_data.
- tt
Differential expression table. Can be output of topTable function. Minimum requirement is that one column stores a metric of increased/decreased expression (i.e. log fold change, t-statistic for differential expression etc) and another contains gene symbols.
- bg
List of gene symbols containing the background gene list (including hit genes). If
bg=NULL, an appropriate gene background will be created automatically.- thresh
The number of up- and down- regulated genes to be included in each analysis (Default: 250).
- annotLevel
An integer indicating which level of
sct_datato analyse (Default: 1).- reps
Number of random gene lists to generate (Default: 100, but should be >=10,000 for publication-quality results).
- full_results
The full output of ewce_expression_data for the same gene list.
- listFileName
String used as the root for files saved using this function.
- showGNameThresh
Integer. If a gene has over X percent of it's expression proportion in a cell type, then list the gene name.
- ttSpecies
The species the differential expression table was generated from.
- sctSpecies
Species that
sct_datais currently formatted as (no longer limited to just "mouse" and "human"). See list_species for all available species.- output_species
Species to convert
sct_dataandhitsto (Default: "human"). See list_species for all available species.- sortBy
Column name of metric in
ttwhich should be used to sort up- from down- regulated genes (Default: "t").- sig_only
Should plots only be generated for cells which have significant changes?
- sig_col
Column name in
ttthat contains the significance values.- sig_thresh
Threshold by which to filter
ttbysig_col.- celltype_col
Column within
ttthat contains celltype names.- plot_types
Plot types to generate.
- save_dir
Directory where the BootstrapPlots folder should be saved, default is a temp directory.
- method
R package to use for gene mapping:
"gprofiler"Slower but more species and genes.
"homologene"Faster but fewer species and genes.
"babelgene"Faster but fewer species and genes. Also gives consensus scores for each gene mapping based on a several different data sources.
- verbose
Print messages.
Value
Saves a set of PDF files containing graphs.
Then returns a nested list with each plot and
the path where it was saved to.
Files start with one of the following:
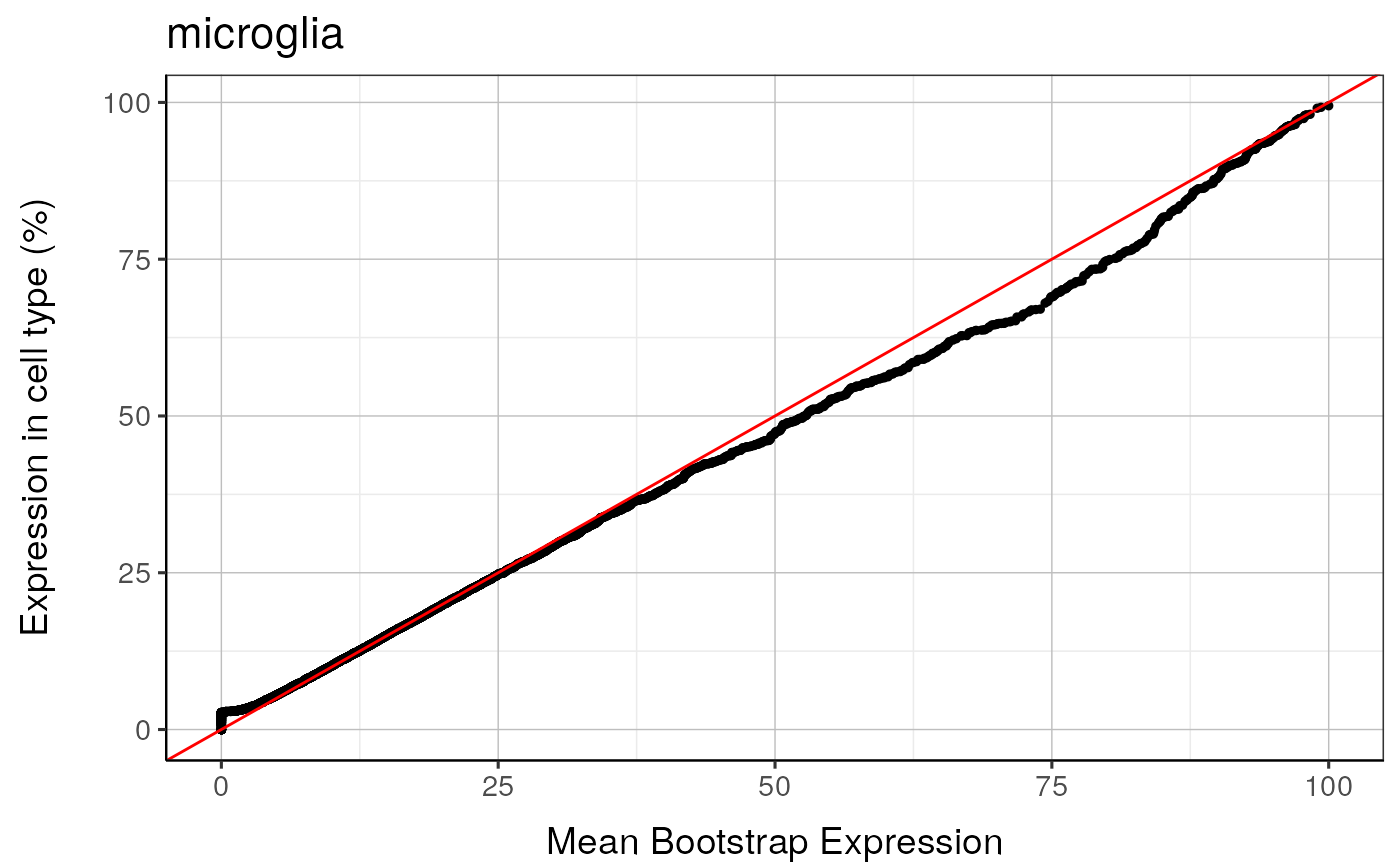
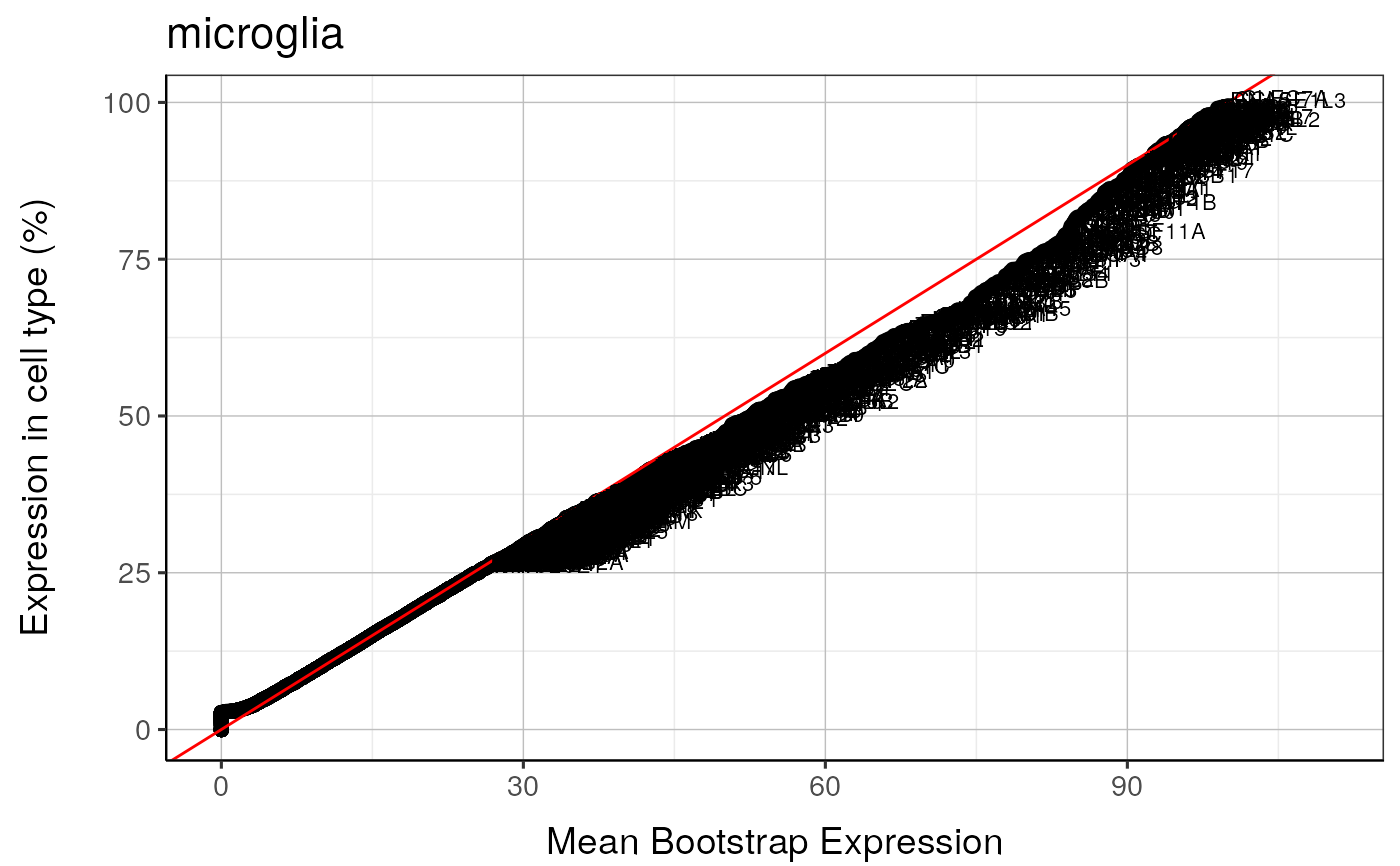
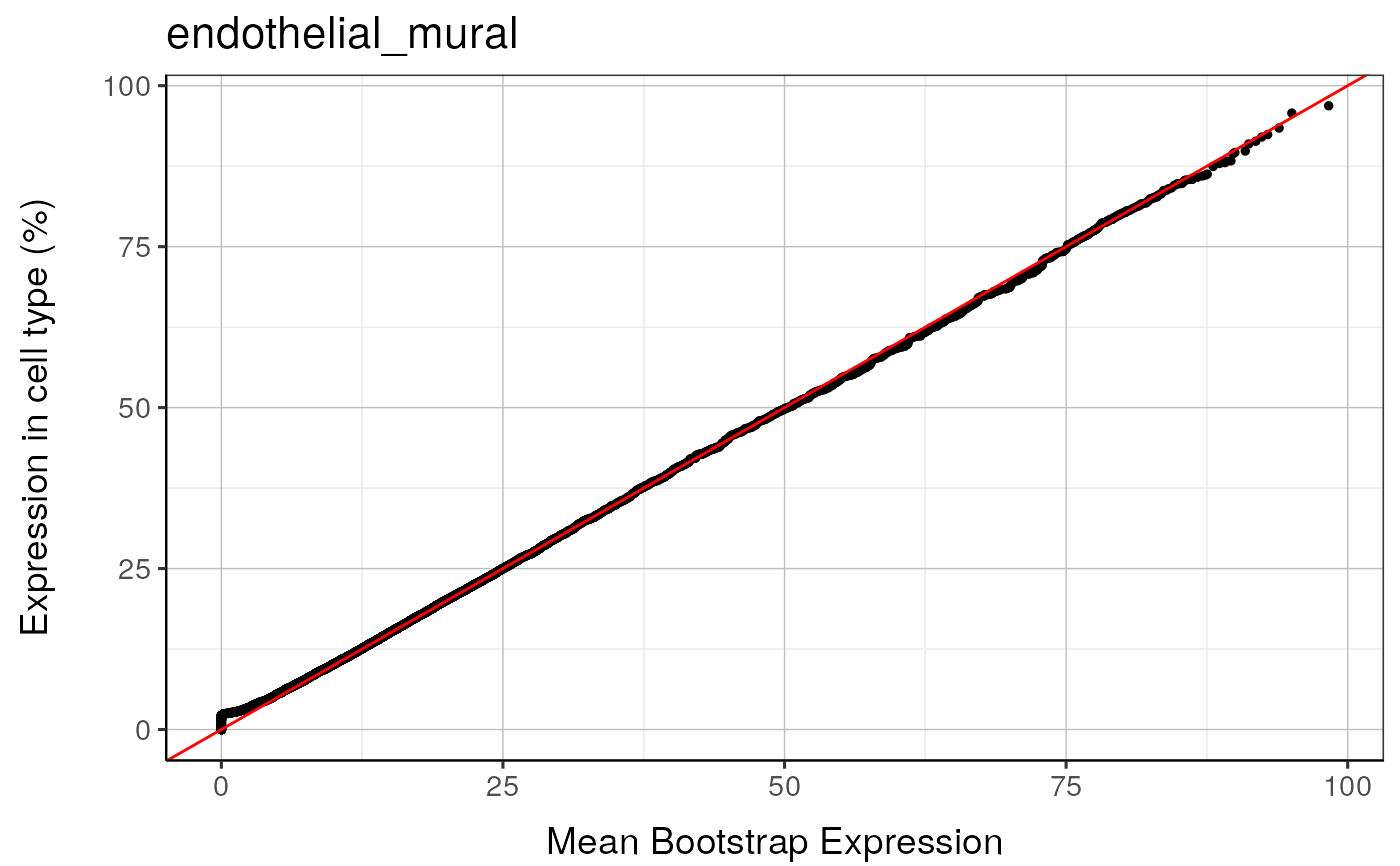
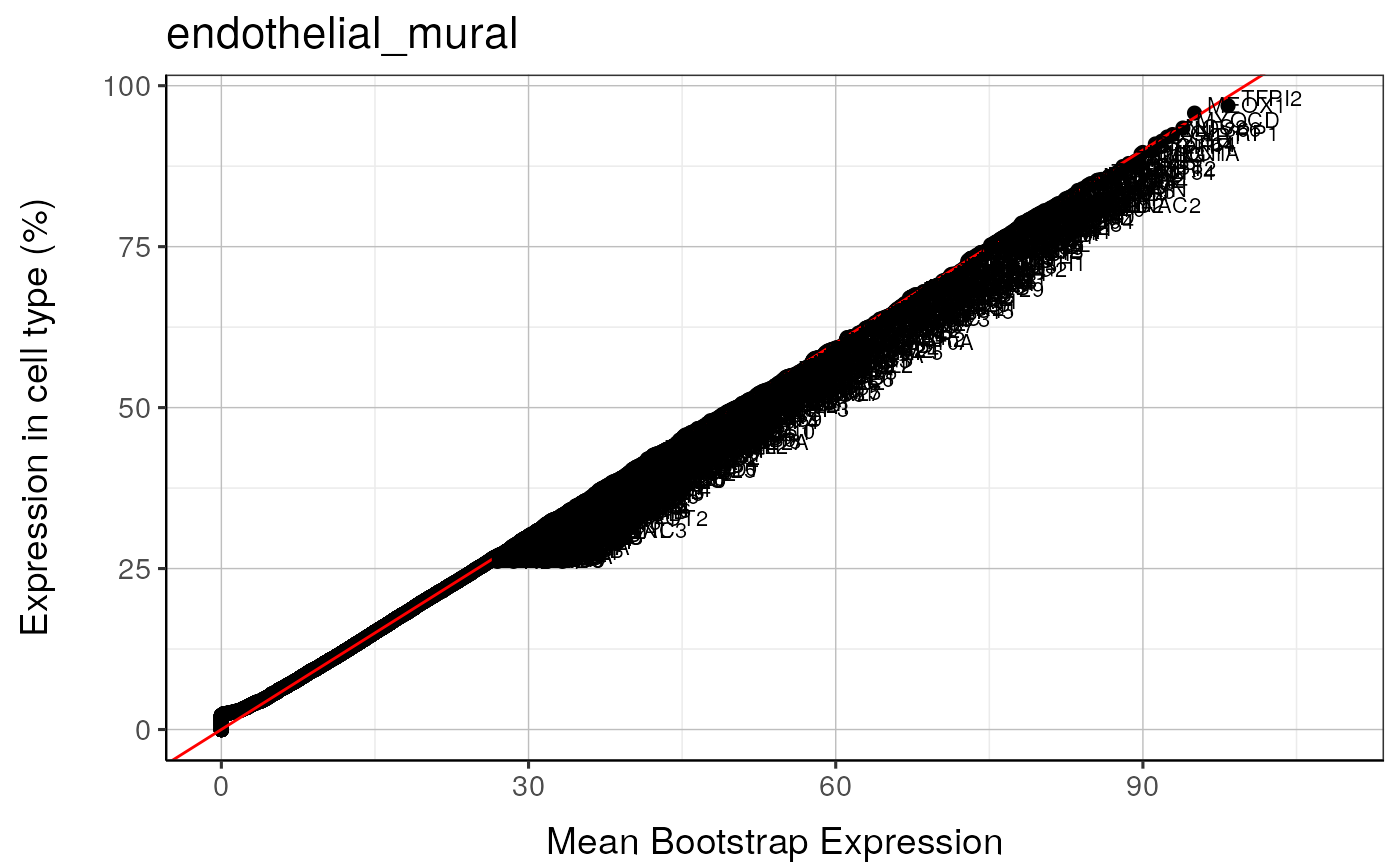
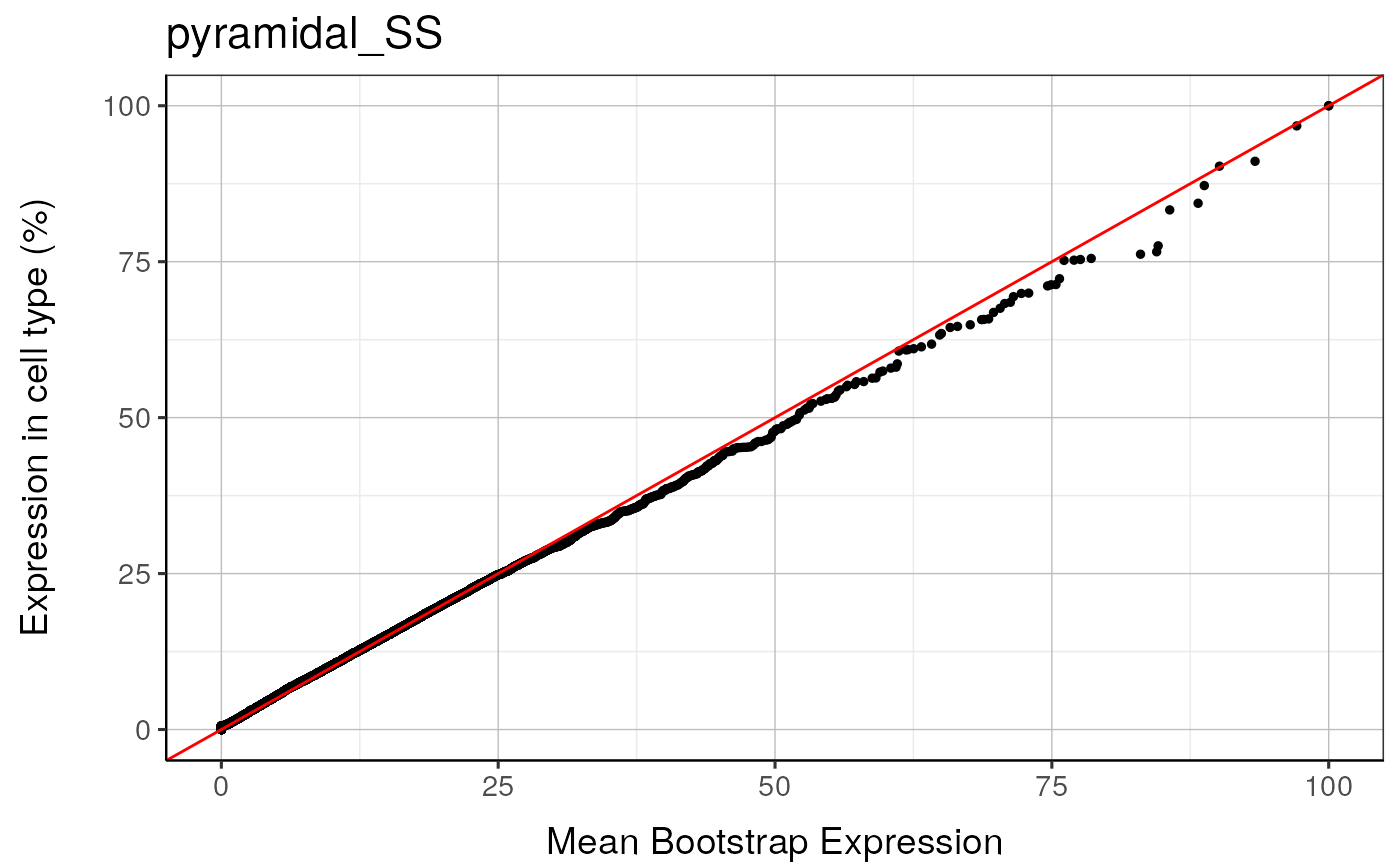
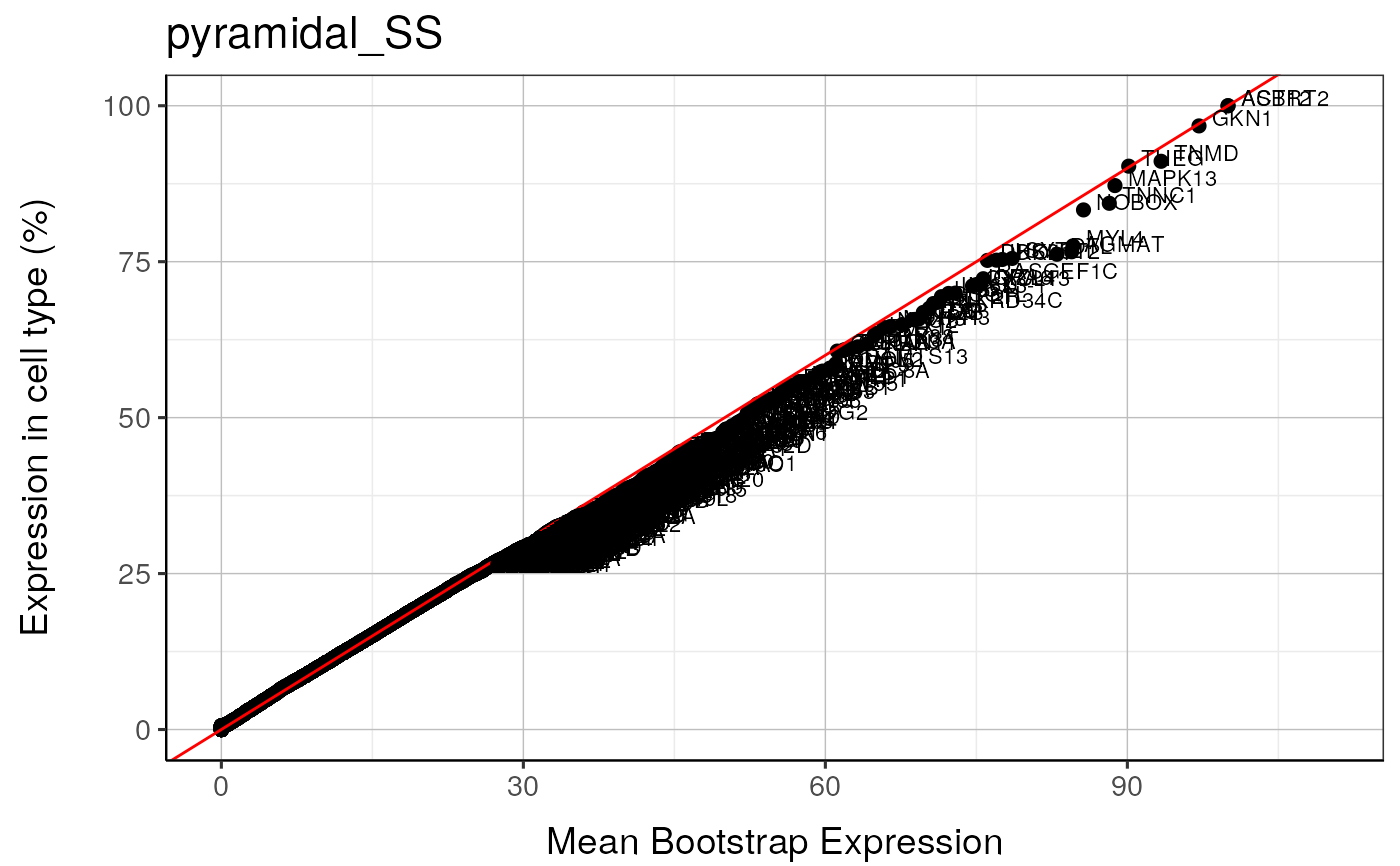
qqplot_noText: sorts the gene list according to how enriched it is in the relevant cell type. Plots the value in the target list against the mean value in the bootstrapped lists.qqplot_wtGSym: as above but labels the gene symbols for the highest expressed genes.bootDists: rather than just showing the mean of the bootstrapped lists, a boxplot shows the distribution of valuesbootDists_LOG: shows the bootstrapped distributions with the y-axis shown on a log scale
Examples
## Load the single cell data
ctd <- ewceData::ctd()
#> see ?ewceData and browseVignettes('ewceData') for documentation
#> loading from cache
## Set the parameters for the analysis
## Use 3 bootstrap lists for speed, for publishable analysis use >10,000
reps <- 3
annotLevel <- 1 # <- Use cell level annotations (i.e. Interneurons)
## Use 5 up/down regulated genes (thresh) for speed, default is 250
thresh <- 5
## Load the top table
tt_alzh <- ewceData::tt_alzh()
#> see ?ewceData and browseVignettes('ewceData') for documentation
#> loading from cache
## See ?example_transcriptome_results for full code to produce tt_results
tt_results <- EWCE::example_transcriptome_results()
#> Loading precomputed example transcriptome results.
## Bootstrap significance test,
## no control for transcript length or GC content
savePath <- EWCE::generate_bootstrap_plots_for_transcriptome(
sct_data = ctd,
tt = tt_alzh,
thresh = thresh,
annotLevel = 1,
full_results = tt_results,
listFileName = "examples",
reps = reps,
ttSpecies = "human",
sctSpecies = "mouse",
# Only do one plot type for demo purposes
plot_types = "bootstrap"
)
#> Warning: genelistSpecies not provided. Setting to 'human' by default.
#> Warning: sctSpecies_origin not provided. Setting to 'mouse' by default.
#> Warning: sctSpecies_origin not provided. Setting to 'mouse' by default.
#> Aligning celltype names with standardise_ctd format.
#> Preparing gene_df.
#> character format detected.
#> Converting to data.frame
#> Extracting genes from input_gene.
#> 15,259 genes extracted.
#> Converting mouse ==> human orthologs using: homologene
#> Retrieving all organisms available in homologene.
#> Mapping species name: mouse
#> Common name mapping found for mouse
#> 1 organism identified from search: 10090
#> Retrieving all organisms available in homologene.
#> Mapping species name: human
#> Common name mapping found for human
#> 1 organism identified from search: 9606
#> Checking for genes without orthologs in human.
#> Extracting genes from input_gene.
#> 13,416 genes extracted.
#> Extracting genes from ortholog_gene.
#> 13,416 genes extracted.
#> Checking for genes without 1:1 orthologs.
#> Dropping 46 genes that have multiple input_gene per ortholog_gene (many:1).
#> Dropping 56 genes that have multiple ortholog_gene per input_gene (1:many).
#> Filtering gene_df with gene_map
#> Returning gene_map as dictionary
#>
#> =========== REPORT SUMMARY ===========
#> Total genes dropped after convert_orthologs :
#> 2,016 / 15,259 (13%)
#> Total genes remaining after convert_orthologs :
#> 13,243 / 15,259 (87%)
#> Generating gene background for mouse x human ==> human
#> Gathering ortholog reports.
#> Retrieving all genes using: homologene.
#> Retrieving all organisms available in homologene.
#> Mapping species name: human
#> Common name mapping found for human
#> 1 organism identified from search: 9606
#> Using cached file: /github/home/.cache/R/orthogene/all_genes-9606-homologene.csv.gz
#> Returning all 19,129 genes from human.
#> Retrieving all genes using: homologene.
#> Retrieving all organisms available in homologene.
#> Mapping species name: mouse
#> Common name mapping found for mouse
#> 1 organism identified from search: 10090
#> Using cached file: /github/home/.cache/R/orthogene/all_genes-10090-homologene.csv.gz
#> Returning all 21,207 genes from mouse.
#> --
#> --
#> Preparing gene_df.
#> data.table format detected.
#> Extracting genes from Gene.Symbol.
#> 21,207 genes extracted.
#> Converting mouse ==> human orthologs using: homologene
#> Retrieving all organisms available in homologene.
#> Mapping species name: mouse
#> Common name mapping found for mouse
#> 1 organism identified from search: 10090
#> Retrieving all organisms available in homologene.
#> Mapping species name: human
#> Common name mapping found for human
#> 1 organism identified from search: 9606
#> Checking for genes without orthologs in human.
#> Extracting genes from input_gene.
#> 17,355 genes extracted.
#> Extracting genes from ortholog_gene.
#> 17,355 genes extracted.
#> Checking for genes without 1:1 orthologs.
#> Dropping 131 genes that have multiple input_gene per ortholog_gene (many:1).
#> Dropping 498 genes that have multiple ortholog_gene per input_gene (1:many).
#> Filtering gene_df with gene_map
#> Adding input_gene col to gene_df.
#> Adding ortholog_gene col to gene_df.
#>
#> =========== REPORT SUMMARY ===========
#> Total genes dropped after convert_orthologs :
#> 4,725 / 21,207 (22%)
#> Total genes remaining after convert_orthologs :
#> 16,482 / 21,207 (78%)
#> --
#>
#> =========== REPORT SUMMARY ===========
#> 16,482 / 21,207 (77.72%) target_species genes remain after ortholog conversion.
#> 16,482 / 19,129 (86.16%) reference_species genes remain after ortholog conversion.
#> Gathering ortholog reports.
#> Retrieving all genes using: homologene.
#> Retrieving all organisms available in homologene.
#> Mapping species name: human
#> Common name mapping found for human
#> 1 organism identified from search: 9606
#> Using cached file: /github/home/.cache/R/orthogene/all_genes-9606-homologene.csv.gz
#> Returning all 19,129 genes from human.
#> Retrieving all genes using: homologene.
#> Retrieving all organisms available in homologene.
#> Mapping species name: human
#> Common name mapping found for human
#> 1 organism identified from search: 9606
#> Using cached file: /github/home/.cache/R/orthogene/all_genes-9606-homologene.csv.gz
#> Returning all 19,129 genes from human.
#> --
#>
#> =========== REPORT SUMMARY ===========
#> 19,129 / 19,129 (100%) target_species genes remain after ortholog conversion.
#> 19,129 / 19,129 (100%) reference_species genes remain after ortholog conversion.
#> 16,482 intersect background genes used.
#> Retrieving all genes using: homologene.
#> Retrieving all organisms available in homologene.
#> Mapping species name: human
#> Common name mapping found for human
#> 1 organism identified from search: 9606
#> Using cached file: /github/home/.cache/R/orthogene/all_genes-9606-homologene.csv.gz
#> Returning all 19,129 genes from human.
#> Returning 19,129 unique genes from entire human genome.
#> Using intersect between background gene lists: 16,482 genes.
#> Standardising sct_data.
#> Using 1st column of tt as gene column: HGNC.symbol
#> Generating exp data for bootstrap genes.
#> Converting data for bootstrap tests to sparse matrices.
#> microglia : Saving bootstrap plot --> /tmp/RtmpPxY94j/BootstrapPlots/qqplot_noText_thresh5__dirUp___examples____microglia.pdf
#> microglia : Saving bootstrap plot --> /tmp/RtmpPxY94j/BootstrapPlots/qqplot_wtGSym_thresh5__dirUp___examples____microglia.pdf
#> microglia : Saving bootstrap plot --> /tmp/RtmpPxY94j/BootstrapPlots/qqplot_wtGSymBIG_thresh5__dirUp___examples____microglia.pdf
#> $plot1
 #>
#> $plot2
#>
#> $plot2
 #>
#> endothelial_mural : Saving bootstrap plot --> /tmp/RtmpPxY94j/BootstrapPlots/qqplot_noText_thresh5__dirUp___examples____endothelial_mural.pdf
#> endothelial_mural : Saving bootstrap plot --> /tmp/RtmpPxY94j/BootstrapPlots/qqplot_wtGSym_thresh5__dirUp___examples____endothelial_mural.pdf
#> endothelial_mural : Saving bootstrap plot --> /tmp/RtmpPxY94j/BootstrapPlots/qqplot_wtGSymBIG_thresh5__dirUp___examples____endothelial_mural.pdf
#> $plot1
#>
#> endothelial_mural : Saving bootstrap plot --> /tmp/RtmpPxY94j/BootstrapPlots/qqplot_noText_thresh5__dirUp___examples____endothelial_mural.pdf
#> endothelial_mural : Saving bootstrap plot --> /tmp/RtmpPxY94j/BootstrapPlots/qqplot_wtGSym_thresh5__dirUp___examples____endothelial_mural.pdf
#> endothelial_mural : Saving bootstrap plot --> /tmp/RtmpPxY94j/BootstrapPlots/qqplot_wtGSymBIG_thresh5__dirUp___examples____endothelial_mural.pdf
#> $plot1
 #>
#> $plot2
#>
#> $plot2
 #>
#> Generating exp data for bootstrap genes.
#> Converting data for bootstrap tests to sparse matrices.
#> pyramidal_SS : Saving bootstrap plot --> /tmp/RtmpPxY94j/BootstrapPlots/qqplot_noText_thresh5__dirDown___examples____pyramidal_SS.pdf
#> pyramidal_SS : Saving bootstrap plot --> /tmp/RtmpPxY94j/BootstrapPlots/qqplot_wtGSym_thresh5__dirDown___examples____pyramidal_SS.pdf
#> pyramidal_SS : Saving bootstrap plot --> /tmp/RtmpPxY94j/BootstrapPlots/qqplot_wtGSymBIG_thresh5__dirDown___examples____pyramidal_SS.pdf
#> $plot1
#>
#> Generating exp data for bootstrap genes.
#> Converting data for bootstrap tests to sparse matrices.
#> pyramidal_SS : Saving bootstrap plot --> /tmp/RtmpPxY94j/BootstrapPlots/qqplot_noText_thresh5__dirDown___examples____pyramidal_SS.pdf
#> pyramidal_SS : Saving bootstrap plot --> /tmp/RtmpPxY94j/BootstrapPlots/qqplot_wtGSym_thresh5__dirDown___examples____pyramidal_SS.pdf
#> pyramidal_SS : Saving bootstrap plot --> /tmp/RtmpPxY94j/BootstrapPlots/qqplot_wtGSymBIG_thresh5__dirDown___examples____pyramidal_SS.pdf
#> $plot1
 #>
#> $plot2
#>
#> $plot2
 #>
#>