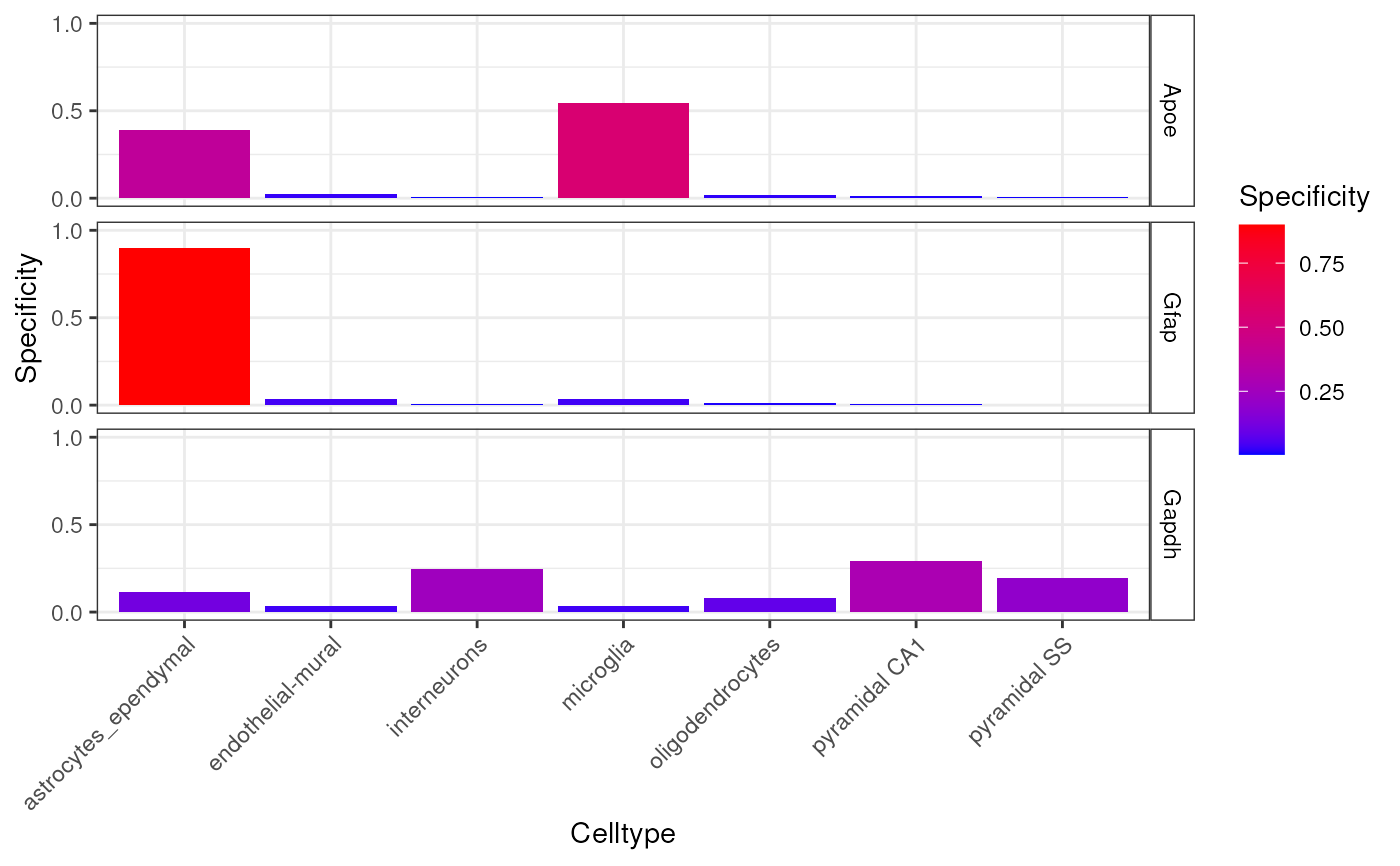
Plot CellTypeData metrics such as mean_exp, specificity and/or specificity_quantiles.
plot_ctd(ctd, genes, level = 1, metric = "specificity", show_plot = TRUE)Arguments
Value
ggplot object.
Plot CellTypeData metrics such as mean_exp, specificity and/or specificity_quantiles.
plot_ctd(ctd, genes, level = 1, metric = "specificity", show_plot = TRUE)ggplot object.